- Have any Questions ?
- info@capstoneplanet.com

India vs Philippines Outsourcing: A Factual Comparison for US and Canadian SMBs
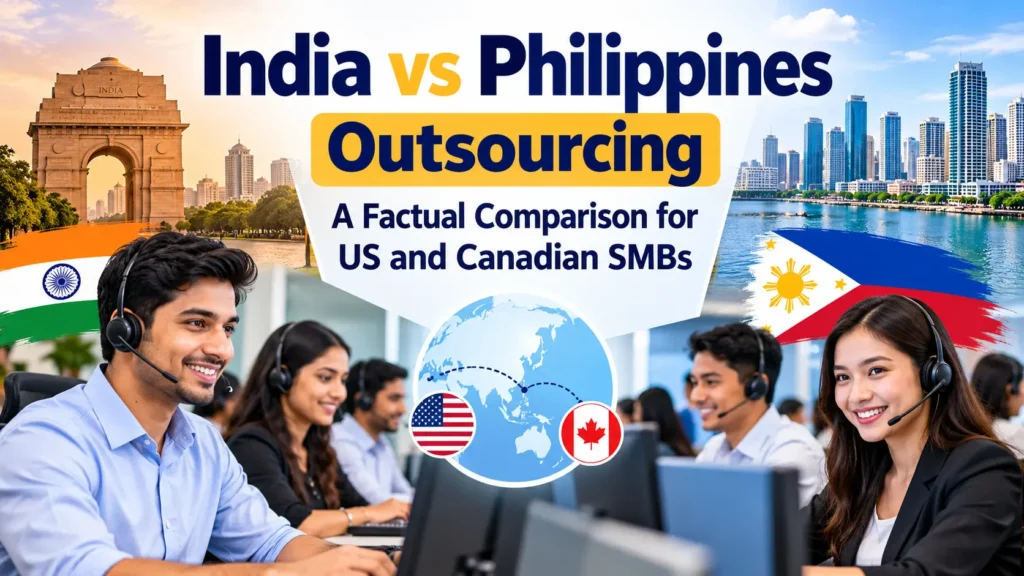
India vs Philippines Outsourcing: A Factual Comparison for US and Canadian SMBs
If you have shortlisted India and the Philippines for an outsourcing programme, the hard part is no longer finding providers. It is defending the choice inside your own company. A CFO asks why one country and not the other. A client asks where their data sits and under whose law. Someone forwards a competitor comparison page that ends in a sales pitch for whichever country that vendor happens to operate in.
This page is built for that situation. It compares the two destinations across six named dimensions, states which destination leads on each and what kind of evidence sits behind the claim, and makes no recommendation for either country.
Key Takeaways
- Outsourcing the work does not move legal accountability, so the buyer stays answerable to its regulator and its customers.
- Read the scope and the period of a SOC 2 Type II report and the scope statement of an ISO/IEC 27001:2022 certificate, not the logo.
- Get the sub-processor register with roles and countries, plus a notice-and-objection window before any change.
- Pin the breach notification clock in the contract; statutes set a floor, the agreement sets the deadline that governs.
- Fix data return, deletion and proof of destruction at signature, when you still have leverage.
Quick Answer
Before you sign with an offshore data processing vendor, confirm the data categories and every country they reach, obtain the sub-processor register, read the SOC 2 Type II scope and period, fix the contract instrument, and set the breach notification window in writing. If you have shortlisted India and the Philippines for an outsourcing programme, the hard part is no longer finding providers. It is defending the choice inside your own company.
How to Use This Comparison (For Buyers Defending a Shortlist)
Meaning or definition. What is being compared here is destination-level outsourcing markets, not individual vendors. “India” and “the Philippines” below refer to national delivery ecosystems: available talent, regulation, time zone position, industry depth and cost structure. Two providers inside the same city can differ more than the national averages do, so every verdict on this page is a starting point for provider-level diligence, not a substitute for it.
Purpose or use. The page exists so that a buyer can defend a two-country shortlist to a CFO, a COO or a board. That means every claim carries a label telling you how much weight to give it, and every figure names its source.
Who it is for. US and Canadian small and mid-sized business owners, operations leads and finance leads who have already shortlisted India and the Philippines and now need to justify the decision. If you are still deciding whether to outsource at all, start with What Is Business Process Outsourcing (BPO)? A Complete 2026 Guide and come back.
Why it matters. Shortlist decisions get challenged internally. Unsourced vendor content does not survive that challenge, because a competitor page that concludes “our country wins” is easy to dismiss once the reader notices who wrote it.
Benefits. One page assembles the six dimensions that decide these programmes, with an evidence class attached to each claim, so you can lift any paragraph straight into a shortlist memo.
Limitations or risks, stated plainly. Three disclosures before you read further.
First, the publisher of this page is an India-based BPO and KPO provider, and readers should weigh that when reading any Indian destination data point [F20]. CapstonePlanet’s own site carries a first-party cost-saving claim of 75 percent or more, which is a marketing figure and not a benchmark; it is labelled as such wherever it appears below and it is why no pricing figure of any kind appears on this page [F20].
Second, destination bias is a known feature of ranking comparison pages. Several of the pages currently ranking for this topic are owned by providers based in one of the two countries being compared, so their claims are evidence of how the market frames the question, not of independent fact. The research behind this page reviewed those pages and treated them as framing evidence only.
Third, for attribution: the strongest positioning claim this page supports is that of a strong competitive candidate. No search ranking, cost outcome or commercial result is guaranteed or claimed.
How to read the evidence labels
The labels below appear throughout. They tell you whether you can quote a line internally as fact or only as an attributed claim.
| Evidence label | What it means | How to treat it in a memo |
|---|---|---|
| Primary or government | Statute text, gazette publication or regulator publication | Quote directly, cite the provision |
| Authoritative index | A published index with a transparent methodology, such as EF EPI | Quote with the index name and year |
| Authoritative time or reference data | Published time zone and clock records | Quote as arithmetic input |
| Official industry body | IBPAP (Philippines) or NASSCOM (India) publishing sector data | Attribute to the body and year |
| Attributed vendor report | A named provider or industry participant publishing data | Attribute in line; do not assert as fact |
| Hedged or directional only | No verifiable source located in this research run | State the uncertainty; use only as a diligence question |
Practical example. Here is the two-sentence shape you can paste into a shortlist memo:
> Language capability: per EF EPI 2025, the Philippines ranks 28th at 569 and India 74th at 484 (EF English Proficiency Index 2025). Evidence class: authoritative index. Caveat: national averages, not function-level scores, and the index does not measure accent neutrality.
That three-part structure, claim, evidence class, caveat, is the format this entire page is written in.
The Six Dimensions at a Glance
This table is the executive summary. If you read one screen and stop, you have the six verdicts, the evidence class behind each and an honest confidence note.
| Dimension | India signal | Philippines signal | Evidence class | Source id | Confidence note |
|---|---|---|---|---|---|
| 1. Language and accent | EF EPI 2025 rank 74, score 484, classified low proficiency, below the global average | EF EPI 2025 rank 28, score 569, classified high proficiency | Authoritative index | F2, F1 | Measured proficiency only. No primary source for accent neutrality was located |
| 2. Time zone coverage | IST, UTC+05:30, year-round, no daylight saving | PhST, UTC+08:00, year-round, no daylight saving | Authoritative time data | F4, F5 | Overlap figures below are arithmetic, not an external statistic |
| 3. Cost structure | No primary or government wage benchmark located in this research run | No primary or government wage benchmark located in this research run | Hedged, directional only | F20 | No country-level saving figure can be asserted |
| 4. Attrition and talent risk | UNVERIFIED at country level in this run | UNVERIFIED at country level in this run | Hedged, directional only | F12 | No primary per-country attrition statistic located. Treat vendor attrition claims as positioning |
| 5. Data protection law | Digital Personal Data Protection Act, 2023, published in the Gazette of India by MeitY | Republic Act No. 10173, the Data Privacy Act of 2012, with the National Privacy Commission as regulator | Primary or government | F7, F8 | Statute text only. Verify current implementation status from the official source before publication or signing |
| 6. Industry maturity | Reported strength in large-scale engineering, data science and knowledge process work | Reported strength in voice and customer-experience delivery depth | Attributed vendor report, plus official industry bodies | F15, F14, F9, F10, F11 | Several available figures are dated or rest on a single secondary report. Date and source class given per figure below |
Two things this table deliberately does not do. It does not declare a single overall winner, and it does not score the dimensions on a weighted scale. Weighting is a buyer decision, because a voice-heavy support programme and a finance close process do not value these six dimensions in the same order.
Relative working-hour overlap, derived from published UTC offsets
Both countries hold one national time zone all year and neither observes daylight saving [F4][F5]. The US and Canada do observe daylight saving. That single fact drives almost every practical scheduling question on this page: the gap between your working day and your provider’s working day changes by one hour twice a year.
The table below is arithmetic derived from the UTC offsets recorded in F4 and F5, not an external statistic. Read the column that matches your own prevailing offset.
| Buyer location and offset | Hours behind IST (UTC+05:30) | Hours behind PhST (UTC+08:00) | A 9:00 am local call lands at, IST | A 9:00 am local call lands at, PhST |
|---|---|---|---|---|
| US Eastern, daylight time (UTC-04:00) | 9.5 hours | 12 hours | 6:30 pm | 9:00 pm |
| US Eastern, standard time (UTC-05:00) | 10.5 hours | 13 hours | 7:30 pm | 10:00 pm |
| US Central, daylight time (UTC-05:00) | 10.5 hours | 13 hours | 7:30 pm | 10:00 pm |
| US Central, standard time (UTC-06:00) | 11.5 hours | 14 hours | 8:30 pm | 11:00 pm |
| US Mountain, daylight time (UTC-06:00) | 11.5 hours | 14 hours | 8:30 pm | 11:00 pm |
| US Mountain, standard time (UTC-07:00) | 12.5 hours | 15 hours | 9:30 pm | midnight |
| US Pacific, daylight time (UTC-07:00) | 12.5 hours | 15 hours | 9:30 pm | midnight |
| US Pacific, standard time (UTC-08:00) | 13.5 hours | 16 hours | 10:30 pm | 1:00 am next day |
| Toronto, daylight time (UTC-04:00) | 9.5 hours | 12 hours | 6:30 pm | 9:00 pm |
| Toronto, standard time (UTC-05:00) | 10.5 hours | 13 hours | 7:30 pm | 10:00 pm |
Practical context. The Philippines sits roughly 2.5 hours closer to North American working hours than India does, in every pairing. That is the whole of the time zone advantage, and it is real: it shrinks the required night shift for roles that need live coverage. But it is not a capability difference. Both destinations already run 24/7 delivery models with night-shift staffing to serve North American clients [F16], so overlap is a cost and retention question rather than a limit on what can be delivered.
If you want the reusable version of this page in your shortlist pack, the checklist at the end of this article is written to be sent to providers in either country.
Dimension 1: Language and Accent Nuance
Meaning or definition. Three different things get bundled into the word “English” during a sourcing decision, and separating them is the whole trick. Measured English proficiency is what an index can score. Accent perception is what a customer experiences. Accent-training requirement is what your provider has to spend before go-live. Only the first of those is evidenced at national level in this research run.
Purpose or use. This dimension decides whether a voice, chat-only or blended channel is supportable from each country.
Who it is for. Buyers scoring customer-facing and voice-heavy roles, where the cost of a mis-hire shows up in customer satisfaction and escalation rate rather than in a headcount line.
Why it matters. Accent and comprehension drive customer satisfaction, escalation rate and training cost. Those are three of the lines most likely to move after a programme goes live.
The strongest available evidence. EF EPI 2025 is the most defensible public measure available here, and it is an authoritative index. The Philippines ranks 28th globally with a score of 569, classified as high proficiency [F1]. India ranks 74th globally with a score of 484, classified as low proficiency and below the global average [F2].
Benefits. The index is published at function level, which lets you compare language capability for the exact function you are outsourcing rather than for a national average. That is a materially better input for a hiring plan.
| Function | Philippines score (EF EPI 2025) | India score (EF EPI 2025) | Gap | Where the gap reads largest |
|---|---|---|---|---|
| Operations | 610 | 487 | 123 | Philippines advantage is wide |
| Admin and Clerical | 600 | 466 | 134 | Philippines advantage is wide |
| Marketing | 600 | 463 | 137 | Philippines advantage is wide |
| Accounting and Finance | 599 | 471 | 128 | Philippines advantage is wide |
| Customer Service | 579 | 531 | 48 | Narrowest gap of the set |
| HR | 580 | 450 | 130 | Philippines advantage is wide |
All six function-level pairs are recorded as F3, sourced to the EF EPI 2025 report, evidence class authoritative index.
Practical context. Read the two ends of that table together, because they point in opposite directions for scheduling.
Take a scripted inbound support queue first. The Customer Service pair is 579 for the Philippines against 531 for India, a 48-point gap and the narrowest in the set. If your requirement is a scripted, measured queue with tight macros and heavy QA, both countries score in the same broad band on this index, and the function-level difference is unlikely to be the deciding factor. A chat-only or blended operation reduces the exposure further, because accent perception is not in play. If chat is the dominant channel, Chat Support Outsourcing Services: Choosing a Provider covers what to test instead.
Now take a consultative finance-close role, where the individual has to explain a variance to a controller in plain English on a live call. The Accounting and Finance pair is 599 against 471, a 128-point gap. The HR pair is the widest of all at 580 against 450. For heavily consultative work, the function-level index data gives a buyer a real reason to concentrate those seats rather than spread them.
Limitations or risks, stated plainly. Three caveats, and they matter more than the scores.
- The EF EPI is a general population index and is not a hiring benchmark for any specific role. It tells you about the language environment a candidate grew up in, not about the individual in front of you.
- It does not measure accent neutrality, accent familiarity for North American callers, or whether accent training will be required. No primary or authoritative source for accent-neutrality or accent-training-hour claims was located in this research run. Any statement about which accent North American customers prefer must therefore be treated as attributed vendor opinion or omitted. This page omits it.
- Some US clients, particularly in regulated sectors, face requirements of their own about who may handle their data or speak to their customers. That is a buyer-side constraint and it is covered in Dimension 5, not here.
Where to go next. The function-level scores above rest on measured proficiency across the workforce, not on cultural alignment. Where cultural familiarity is the question, the reported industry framing on this topic is recorded under Dimension 6 as attributed vendor material, not as fact. For the customer-service function specifically, Customer Service in BPO: What It Is and How to Decide sets out how to structure the role before you decide where to place it.
Dimension 2: Time Zone Coverage for US and Canadian Buyers
Meaning or definition. An overlap window is the stretch of a day when your team and your provider’s team are both at work. A shift differential is the pay premium attached to working outside normal hours. Follow-the-sun coverage is a model where work hands off between locations so that a process runs continuously.
Purpose or use. Overlap is how you choose between real-time and asynchronous work, and it is the input to your shift-shape decision. The overlap matrix under “The Six Dimensions at a Glance” gives you the window; this section tells you what to do with it.
Who it is for. Buyers whose processes need live collaboration with US or Canadian staff: escalations, approvals, month-end closes, engineering stand-ups.
Why it matters. Overlap determines meeting windows, escalation paths and whether a night shift is required at all. A night shift is not free; it carries a differential and carries higher attrition pressure.
The arithmetic, in plain terms. India operates a single national time zone, Indian Standard Time, at UTC+05:30 year-round, with no daylight saving changes [F4]. The Philippines operates a single national time zone, Philippine Standard Time, at UTC+08:00 year-round, with no daylight saving changes, maintained by PAGASA under Republic Act No. 10535 [F5]. Secondary material records that Philippine Standard Time was established as the official national time standard by Republic Act No. 10535, signed 15 May 2013, administered by PAGASA, with no daylight saving time observed; that source is secondary rather than primary, so the statute itself should be cited if retrieved before publication [F6].
Worked example, Toronto buyer, 9:00 am Eastern stand-up. On a standard-time date, 9:00 am Eastern (UTC-05:00) is 7:30 pm IST and 10:00 pm PhST. Both destinations must staff an evening or night shift for that slot. The difference is that the Philippines is staffing into late evening while India is staffing into early evening, which is the difference between a shift that a local labour market accepts as an evening shift and one it treats as a night shift. On a daylight-time date, 9:00 am Eastern (UTC-04:00) is 6:30 pm IST and 9:00 pm PhST, and the same 2.5-hour separation holds.
Benefits. The Philippines sits closer to North American working hours, which shrinks the required night shift for some roles and reduces shift-differential exposure. In every pairing in the overlap matrix, the Philippine window is 2.5 hours later in local terms than India’s.
Limitations or risks. Neither country observes daylight saving time while the US and Canada do [F4][F5], so every overlap figure in this article shifts by an hour twice a year. Any overlap figure you see anywhere, including on this page, must be labelled with the assumed North American offset; an unlabelled overlap claim is not usable for scheduling. And because both countries run 24/7 delivery via night shifts [F16], overlap is a cost and retention factor, not a capability limit.
| Shift shape | Typical fit | India implication | Philippines implication |
|---|---|---|---|
| Full night shift | Voice queues covering US Pacific business hours; live incident response | Standard for Pacific-facing coverage | Standard for Pacific-facing coverage |
| Partial overlap shift | Real-time escalation desks, approvals, month-end closes | Needs an early evening start for Eastern coverage | Needs a late evening start for Eastern coverage |
| Fully asynchronous handover | Back-office processing, AP and AR batches, QA review, documentation | Workable with a daytime shift and a written handover | Workable with a daytime shift and a written handover |
The practical reading: the time zone difference between these two destinations is one of degree, not of kind. If your process tolerates a written handover, time zone overlap barely discriminates between them. If your process needs a live human on the same call as your controller every morning, the Philippine position is the easier staffing proposition. Back Office Outsourcing: The Complete 2026 Guide covers which back-office processes tolerate asynchronous handover and which do not.
Dimension 3: Cost Structure (Drivers, Not a Price Sheet)
Meaning or definition. Headline hourly rate is the number on the front of a proposal. Loaded cost is what you actually pay once shift differential, statutory employer contributions, attrition-driven replacement, management overhead and connectivity are added. Total cost of ownership is loaded cost across the whole contract term, including the ramp.
Purpose or use. Build a cost model you can defend in a budget review, rather than repeating a vendor’s headline rate to your own finance team.
Who it is for. Finance leads and owners approving spend.
Why it matters. Headline rate comparisons are the most common way a shortlist gets overridden by an unsourced number. Someone finds a page saying one country is 60 percent cheaper, and the argument moves to that number instead of to your requirements.
The honest position on numbers. No primary or government wage benchmark for either country was located in this research run. Therefore no side-by-side salary figure and no country-level saving percentage is asserted anywhere on this page. Every cost claim in the ranking competitor set reviewed for this article is vendor positioning and is treated here as evidence of how the market frames the comparison, not as factual authority for a rate.
Benefits of a driver-based approach. A framework built on drivers survives vendor pricing changes and lets you normalise quotes that are structured differently. Two proposals will rarely use the same line items; a driver model puts them on the same basis.
| Cost driver | Why it differs between India and the Philippines | Which line of a quote it should appear on |
|---|---|---|
| Base salary band | Local labour market rates differ by role and by city within each country | Base FTE rate |
| Shift differential | Both countries staff night shifts for North American hours; the required shift length differs with time zone position | Shift or out-of-hours line, often a percentage |
| Statutory employer contributions | Payroll taxes, social security and mandated benefits follow each country’s own labour code | Statutory load, sometimes bundled invisibly into base rate |
| Attrition-driven replacement | Recruitment, training and ramp cost each time a seat turns over | Attrition allowance or replacement clause |
| Real estate and seat cost | Depends on whether delivery is in Metro Manila, Cebu or Davao, or in Bengaluru, Hyderabad or Chennai, and whether work is on-site or remote | Facilities or seat line, or bundled into rate |
| Connectivity and redundancy | Site resilience, backup power and secondary-site arrangements | Infrastructure or business-continuity line |
| Management span | How many agents one team lead supervises, which differs by process complexity and by market maturity | Management overhead, often expressed as a ratio |
| Currency exposure | Contract denomination versus delivery cost currency, plus hedging or repricing clauses | Commercial terms, not a rate line |
Limitations or risks. Attrition replacement, shift differential and statutory load all vary by role and by city, so any single country-level saving percentage is not a usable planning figure. Separately and explicitly: the publisher’s own site carries a stated cost-saving claim of 75 percent or more [F20]. That is a first-party marketing figure from a provider’s own website. It is not a benchmark, it is not independently verified, and it is labelled here so that a reader weighing this page can discount it the same way they should discount any vendor’s headline saving.
Cost model template. Populate this with your own quotes. The blank cells are deliberate: the point is that you fill them, not that this page fills them for you.
| Line | Quote A | Quote B | Notes to record |
|---|---|---|---|
| Base rate per FTE | Confirm currency, period and hours included | ||
| Shift differential | State the shift definition it applies to | ||
| Statutory load | Confirm whether already included in base rate | ||
| Attrition allowance | Ask what triggers a replacement and at whose cost | ||
| Management overhead | Record the span of control, not just the cost | ||
| Facilities and connectivity | Ask about site resilience and redundancy | ||
| Implementation and ramp | One-off, so keep it out of the steady-state line | ||
| Total loaded cost per FTE | The only number to compare |
Practical example, clearly labelled illustrative. Imagine two proposals quoting the same headline hourly rate. Add a night-shift differential to one and a higher attrition allowance to the other, and the loaded cost per full-time equivalent separates even though the front page of both proposals looked identical. The percentages you choose here are illustrative of the method, not benchmarked figures, because no primary benchmark was located in this run. The formula is:
> Loaded cost per FTE = base rate + shift differential + statutory load + attrition allowance + management overhead + facilities and connectivity.
Run that against your own two quotes before you compare anything. If the process you are placing is a finance function, Accounts Payable Outsourcing: The Complete 2026 Guide and Accounts Receivable Outsourcing: Complete 2026 Guide set out what those roles actually contain, which determines which drivers dominate.
Dimension 4: Attrition and Talent Risk
Meaning or definition. Attrition rate is the proportion of a team that leaves over a period. Regretted attrition is the departure of people you wanted to keep, which is the number that actually hurts. Non-regretted attrition is a managed exit. Time-to-fill is how long a seat sits empty before a replacement is productive.
Purpose or use. Convert attrition from an anecdote into a contractual protection and a cost line.
Who it is for. Buyers signing multi-year agreements and operations leads staffing steady-state teams.
Why it matters. Attrition is the main reason a working offshore team can degrade after year one, and it is the least well evidenced claim across the comparison pages currently ranking for this topic.
The honest position. This is the hardest evidentiary problem on this page. No primary or government attrition statistic for either country was verified in this research run. Every attrition number that appears in competitor content on this topic is vendor positioning. Accordingly, this section asserts no attrition figure for either country and does not imply that attrition is systematically higher in one country than the other.
What can be described instead are mechanisms, which are structural and destination-neutral in their logic.
| Attrition driver | How it plays out in India | How it plays out in the Philippines | Buyer-side mitigation |
|---|---|---|---|
| Wage inflation in tight local markets | Delivery hubs compete for the same experienced staff, pushing pay expectations up during growth periods | Delivery hubs compete for the same experienced staff with a heavier concentration in voice and customer-experience roles | Negotiate a repricing mechanism with a defined index rather than accepting open-ended annual uplifts |
| Poaching between competing delivery centres | Dense delivery clusters mean a trained agent is a short walk from a competitor | Same dynamic in the main delivery hubs | Ask for the provider’s retention data for your specific account, not company-wide |
| Night-shift attrition pressure | Night shifts are required for North American coverage on many roles | Night shifts are required, though time zone position shortens some of them | Price the shift differential explicitly; if a provider will not break it out, treat that as a diligence flag |
| Promotion ceiling at SMB scale | A small account may not generate enough volume to create promotion paths | Same constraint | Ask for a documented career ladder and cross-skilling plan, and a named escalation path for high performers |
| Management bench thinness | Team lead quality varies widely between providers | Same | Interview the actual team lead during diligence, not just the account director |
Evidence status table. This is the reviewer-facing version of the position above.
| Attrition claim | Source located? | Required wording |
|---|---|---|
| Any specific attrition percentage attributed to India | No primary or authoritative source in this run | Do not assert. Omit or attribute in line as “reported by [publisher, year]” with the provider named as a vendor or industry body |
| Any specific attrition percentage attributed to the Philippines | No primary or authoritative source in this run | Do not assert. Omit or attribute in line with the same hedge |
| Attrition being higher in one country than the other | No comparative source located | Do not assert at all |
| Attrition being a material risk for North American outsourcing programmes | Mechanistic, not statistical | May be stated as a risk, not as a measured rate |
Practical context: contract protections that are destination-neutral. This is the useful output of the section. Ask for all five, whichever country you shortlist.
- Replacement-time service level. A written commitment that a departing seat is refilled within a defined number of days, with a service credit if it is not.
- Tenure guarantee. A minimum average tenure or a cap on annual turnover for your named account, with a remedy attached.
- Laddered pricing. Staged rate increases over the term instead of a single open-ended annual uplift, so wage inflation is priced before you sign rather than after.
- Knowledge-transfer requirement. Documented process maps and cross-training so that an individual departure does not remove institutional knowledge.
- Named-team commitment. Named staff for your account, with a defined process and notice period before substitution.
Worked example, clearly labelled illustrative. A 15 percent annual attrition assumption on a 20-seat team means three replacement events a year. Each replacement carries recruitment cost, training cost and a ramp period during which output is below steady state. Compound that over a three-year term and the cumulative drag on productive capacity is meaningful even before you add the management time spent hiring. The 15 percent figure is used to demonstrate the method, not as a benchmark for either country, because no primary per-country statistic was located in this run.
For the HR mechanics of this, including how to specify replacement service levels in a services agreement, see HR Outsourcing Services in 2026. For the foundational distinctions between BPO and KPO scope, which affects how much institutional knowledge sits in individual heads, What Is Business Process Outsourcing (BPO)? A Complete 2026 Guide is the relevant starting point.
Dimension 5: Data Protection Law (DPDP Act 2023 vs RA 10173)
This is the dimension no ranking competitor covers, and it is the one most likely to be raised by your own client or your own counsel. It is worth reading in full even if you skimmed the rest.
Meaning or definition. Personal data is information about an identified or identifiable individual. India’s statute uses the term data fiduciary for the entity that determines the purpose and means of processing; the Philippine statute uses personal information controller for the equivalent role, and data processor for an entity that processes on another’s instruction. In an outsourcing engagement, you are typically the controller or fiduciary and your provider is typically the processor, which matters because most obligations attach to the former.
Purpose or use. This dimension lets you answer due-diligence and client-contract questions about where personal data is processed and under whose law.
Who it is for. Buyers handling US or Canadian consumer data, especially those whose own clients impose contractual privacy terms that flow down to vendors.
Why it matters. Your own obligations do not transfer to your provider’s jurisdiction. US state privacy laws, Canadian PIPEDA and provincial privacy statutes, HIPAA and GDPR obligations all travel with the data regardless of where it is processed. Neither destination solves that for you, and a provider saying “we are compliant” does not address it.
The statutory comparison
Every cell below references the government text it comes from. Two statutes are cited: India’s Digital Personal Data Protection Act, 2023, published in the Gazette of India by the Ministry of Electronics and Information Technology (MeitY) [F7], and the Philippines’ Republic Act No. 10173, the Data Privacy Act of 2012, which establishes the National Privacy Commission as regulator and covers general data privacy principles, rights of the data subject, security of personal information, accountability for transfer of personal information, and penalties in Sections 25 to 36 [F8]. Both are primary or government sources.
| Dimension | India: DPDP Act, 2023 | Philippines: RA 10173, Data Privacy Act of 2012 |
|---|---|---|
| Statute identity | Digital Personal Data Protection Act, 2023 | Republic Act No. 10173, the Data Privacy Act of 2012 |
| Publication | Published in the Gazette of India by MeitY [F7] | Hosted by the National Privacy Commission, the statute’s regulator [F8] |
| Regulator | Data Protection Board of India, under the MeitY-published statute framework [F7] | National Privacy Commission [F8] |
| Scope and applicability | Governs processing of digital personal data, with obligations on the entity that determines processing [F7] | Covers data privacy principles, data-subject rights, security of personal information and accountability for transfer [F8] |
| Entity obligations | Obligations on the data fiduciary under the statute [F7] | Security of personal information and accountability for transfer of personal information [F8] |
| Data-subject rights | Set out in the statute [F7] | Rights of the data subject set out in the statute [F8] |
| Cross-border transfer | Contained in the statute; verify the current rules and any notifications from the official source [F7] | Accountability for transfer of personal information is addressed in the statute [F8] |
| Breach notification | Contained in the statute and any rules issued under it; verify from the official source [F7] | Covered within the statute’s security and notification provisions; verify from the National Privacy Commission [F8] |
| Penalties | Contained in the statute; verify the current text from the official source [F7] | Defined penalty sections, Sections 25 to 36 [F8] |
How to read that table. The Philippine regime is long established with an operating regulator. India’s regime is newer, and its rules, notifications and implementing regulations are the place where detail that affects a live engagement would appear. This page therefore does not assert a maturity judgement for either regime. It directs you to verify the current implementation status from the official source at the time of writing and, where rules or notifications have been issued since the statute, to cite the issuing government or regulator page directly rather than any secondary summary.
Limitations or risks. Neither statute is a substitute for your own obligations. If you handle US consumer data, your state privacy obligations apply. If you handle Canadian personal information, PIPEDA and the applicable provincial statute apply. If you are a HIPAA covered entity or business associate, those obligations follow the data. If you process EU personal data, GDPR applies. The vendor’s jurisdiction does not change any of that, and a destination-level comparison cannot resolve it.
Practical context: the diligence question to ask. Ask this, and ask for the answer in writing:
> “Please confirm in writing: (1) the legal entity that will process our personal data and where it is incorporated; (2) the physical location where our personal data will be stored and processed, including any backup or secondary site; (3) which regulator has jurisdiction over that entity’s processing, and under which statute; (4) your breach-notification obligation and the timeline you commit to, including the clock start point; and (5) whether any sub-processor will touch our data, and if so which one.”
That question is deliberately answerable by a provider in either country. It is the first block of the checklist at the end of this article.
| Diligence question | Statutory basis for asking it |
|---|---|
| Which legal entity processes our data, and where is it incorporated? | Entity obligations sit with the processing entity under each regime [F7][F8] |
| Where is our personal data stored and processed, including backups? | Security of personal information [F8]; data-processing scope [F7] |
| Which regulator has jurisdiction over your entity? | Data Protection Board of India [F7]; National Privacy Commission [F8] |
| What is your breach-notification timeline and who starts the clock? | Breach and security provisions in each statute; verify current text [F7][F8] |
| How do you handle a transfer to a sub-processor or affiliate? | Accountability for transfer of personal information [F8]; transfer provisions [F7] |
| What is your maximum penalty exposure, and how does that interact with our indemnity? | Defined penalty sections, Sections 25 to 36 [F8]; penalty provisions [F7] |
| How will you support our own obligations under US state privacy law, PIPEDA, HIPAA or GDPR? | Buyer-side obligations, not transferable to the vendor’s jurisdiction |
Worked example, a breach-notification clock question. During contracting, ask what the notification clock starts from: discovery, internal confirmation, or a completed investigation. Ask how many business days the provider commits to, and ask whether that timeline meets your own downstream obligation to your clients and to your regulator. A provider who answers this precisely is telling you something about the maturity of their compliance function. A provider who says “we are compliant” is telling you nothing.
If your programme is knowledge-heavy rather than transactional, Knowledge Process Outsourcing covers the engagement models where the data protection question becomes the dominant commercial risk rather than a line item.
Dimension 6: Industry Maturity and Function Fit
Meaning or definition. Industry maturity, in operational terms, is not headcount. It is delivery depth in a function, the size of the supervisory bench above the agent layer, the presence of a support ecosystem such as training and quality vendors, the quality of process documentation, and the resilience of continuity planning. A mature market lets you hire a team lead on two weeks’ notice; an immature one does not.
Purpose or use. Decide which functions to place in which country, and whether to split an engagement.
Who it is for. Buyers deciding between a single-country and a dual-country model.
Why it matters. Function fit is the practical output of the whole comparison. Maturity is what you are actually buying beyond headcount.
The two reported strengths. Read the following as attributed industry characterisation, not as a statistical finding.
The Philippines has held the position of world’s call center capital since approximately 2010, with Metro Manila, Cebu and Davao as the major delivery hubs, according to a named provider’s published comparison (F14, attributed vendor report). English is an official language of the Philippines and is taught from primary school through university, per the same source (F17, attributed vendor report). The Philippines has decades of US cultural influence, which industry sources report as translating to faster team integration and lower management overhead for US, Australian and Canadian clients (F19, attributed vendor report).
India is reported as the stronger destination for large-scale enterprise software engineering, data science, AI and machine learning, and research-intensive knowledge process outsourcing, due to STEM talent depth and hubs in Bengaluru, Hyderabad and Chennai (F15, attributed vendor report). India’s professional culture was shaped by British colonial history and enterprise IT and BPO work with UK and European clients, which the same reported framing describes as stronger cultural alignment for UK buyers than for US buyers (F18, attributed vendor report).
Industry scale, with dates and source classes attached. Several figures available on this topic are stale or rest on a single secondary report, so every number below carries its date and its class.
| Figure | Value | Date | Source class | Source id |
|---|---|---|---|---|
| Philippines IT-BPM sector revenue | Widely reported at approximately USD 40 billion | Not dated in this run | Official industry body, read from search snippets rather than a fully retrieved primary document | F9 |
| Philippines IT-BPM workforce | Widely reported at about 1.9 million workers | Not dated in this run | Official industry body, read from search snippets rather than a fully retrieved primary document | F9 |
| Philippines IT-BPM roadmap | Revenue, headcount and roadmap material published, covering a roadmap to 2028 | Published material | Official industry body | F10 |
| India outsourcing and IT services workforce | Reported at approximately 5.95 million people | Reported figure; year not established in this run | Secondary report | F12 |
| India outsourcing contribution to GDP | Reported at around 7 percent | Reported figure; year not established in this run | Secondary report | F12 |
| India STEM graduate supply data | Published by NASSCOM as labour supply data for the India tech industry | 2023 publication | Industry body | F11 |
| India current-year IT-BPM industry size and revenue | No primary figure read directly from an Indian industry body document in this run | – | UNVERIFIED | – |
| Per-country attrition rate for either country | No primary or authoritative figure located | – | UNVERIFIED | – |
The Philippine figures are attributed because IBPAP and its news room were confirmed as the authoritative industry body and the categories it publishes, while the specific current-year numbers were read from search-result snippets and a secondary report rather than from a fully retrieved primary document in every case. The Indian workforce and GDP-share figures come from a single secondary news report and must be attributed with that limitation stated, which is what the table does. Where a specific current-year figure could not be read from the primary industry body document, it is marked UNVERIFIED rather than estimated.
The reported index result, labelled precisely. One secondary news report states that the Philippines ranked first on the Ataraxis Global Outsourcing Talent Index with a score of 90.65, ahead of Malaysia and India, on cost competitiveness, English proficiency and workforce capability, and that the index reportedly scored the Philippines 90 versus India 60 on English proficiency (F13, secondary news report). This is presented here as a reported index result, not as an authoritative ranking. The underlying index methodology and the primary publication were not independently retrieved in this research run, so the figure carries a single-secondary-source limitation. Treat it as a media data point, and prefer the EF EPI function-level scores in Dimension 1 for any decision that turns on language capability.
Function-fit table. This is the practical output of the section.
| Function | Stronger maturity on the available evidence | Evidence basis | Residual risk to manage |
|---|---|---|---|
| Voice customer service and customer experience | Philippines | Reported delivery depth since approximately 2010 and hub concentration (F14, attributed vendor report); EF EPI Customer Service scores (F3, authoritative index) | Night-shift staffing where US hours require it [F16] |
| Chat and written support | Either | EF EPI does not measure channel-specific performance; no channel-level source located | Accent exposure is removed, so test written tone and escalation judgement instead |
| Back-office processing and data entry | Either | Structural parity; no function-specific maturity source located for either country | Specify accuracy and turnaround service levels rather than assuming a country advantage |
| Finance and accounting operations | Either, with a caveat | EF EPI Accounting and Finance scores show a wide function-level gap (F3, authoritative index) for consultative work; no maturity source located | Separate transactional processing from consultative advisory work, and place them differently if needed |
| Software engineering, data science and AI | India | Reported STEM talent depth and hub concentration (F15, attributed vendor report); NASSCOM publishes labour supply data (F11, industry body) | Maturity claims are attributed vendor framing; test with a paid pilot |
| Knowledge process and research-intensive work | India | Same as above (F15, attributed vendor report) | Price the data protection dimension alongside the capability dimension; see Dimension 5 |
| HR and payroll operations | Either, with a caveat | EF EPI HR scores show the widest function-level gap of the set (F3, authoritative index) | Confirm jurisdiction-specific payroll and statutory knowledge during diligence |
Benefits. The table separates voice and customer-experience depth from engineering and knowledge-process depth, so you can split scope deliberately rather than averaging two countries into a vague compromise.
Practical example, a scope split, presented as an illustration of trade-offs and not a recommendation. A mid-market buyer might place customer support in the Philippines on the reported voice depth and the EF EPI function-level scores, and finance operations in India on the EF EPI Accounting and Finance scores and reported finance and accounting delivery depth. The cost of that arrangement is governance overhead: two contracts, two compliance reviews, two escalation paths, and a monthly management rhythm that an SMB with a part-time vendor-management capacity may not be able to sustain. A single-country model has one governance surface and accepts the trade-off on the weaker dimension. Neither is inherently correct.
Bilingual, Cost-Sensitive and Regulated Buyers: How the Dimensions Interact
Meaning or definition. A trade-off profile is a buyer situation in which two of the six dimensions pull in opposite directions, so the decision cannot be made by averaging scores. Trade-offs, not individual facts, are where shortlist defence usually fails.
Purpose or use. Help you pick the dimensions that dominate in your situation rather than treating six dimensions as one weighted average.
Who it is for. Owners and operations leads who must explain a split or a single-country choice to a board.
Why it matters. Two of the profiles below are constrained by your own obligations rather than by anything in either destination, and those are the ones most likely to be raised late in a sales cycle.
| Buyer profile | Dimensions that dominate | Dimensions that can be traded down | Diligence action required |
|---|---|---|---|
| Voice-first customer experience programme | Language and accent; time zone coverage; industry maturity in customer experience | Cost structure can be traded within the range of your own quotes | Test live call quality with your own script and your own customers’ accent profile; do not accept a national index score as the test |
| Engineering-heavy product work | Industry maturity in engineering, data and knowledge processes; attrition and talent risk | Time zone coverage, because engineering workflows tolerate asynchronous handover | Ask for named engineers, current tenure and the substitution process before you sign |
| Regulated or personal-data-heavy process work | Data protection law; then attrition and talent risk | Cost structure, because a compliance failure dominates any rate difference | Run the full Dimension 5 diligence question list and get written answers before commercial negotiation |
| Cost-sensitive, process-standardised work | Cost structure, on your own loaded-cost model; shift shape | Language and accent, because the process is not customer-facing | Compare loaded cost per FTE only, never headline rate, and split out the shift differential |
Two constraints that matter for Canadian and US buyers
The Canadian bilingual requirement. No source was located in this research run evidencing French-language capability at delivery scale in either India or the Philippines. This is stated as a buyer diligence question and the capability is marked unverified for both countries. If you serve Quebec or have a federal French-language service obligation, treat this as an open item to be tested with a real assessment, not an item to be assumed either way. The same applies to Spanish-language requirements for US buyers: no source was located in this run, so the requirement is recorded as a diligence question with the capability unverified.
US and Canadian privacy obligations. For any claim about Canadian privacy obligations or US state privacy obligations, the correct reference is the official regulator or statute page: the Office of the Privacy Commissioner of Canada and PIPEDA for Canadian personal information, the applicable provincial regulator where relevant, and the relevant state statute for US state privacy law. This page makes no claim about the content of those obligations and instead frames them as questions to put to a provider, because your obligations under them do not transfer to the vendor’s jurisdiction and neither destination resolves them.
Practically, what the profiles mean. A cost-sensitive buyer with a standardised, non-customer-facing process is the profile least sensitive to destination and most sensitive to their own cost model, because both countries can service the work and neither has an evidenced advantage in it. That is also the smallest difference between the two destinations in this whole article. Chat Support Outsourcing Services: Choosing a Provider and HR Outsourcing Services in 2026 cover the provider-selection mechanics for channel and back-office scope respectively.
A Shortlist Defence Checklist
Meaning or definition. Shortlist defence is the internal documentation you need before a decision is approved: the evidence, the answers and the contractual protections that let you answer “why this provider” and “why this country” without relying on a vendor’s own comparison page.
Purpose or use. A portable checklist. It is designed to be sent to providers in either country, so that the answers, not the country, drive the decision.
Who it is for. The buyer who has to present a recommendation to a CFO, COO or board.
Why it matters. A comparison that cannot be quoted internally does not influence the decision. This section converts each of the six dimensions into an evidence request.
Limitations or risks. The checklist is a diligence tool, not a compliance certification. Completing it does not establish that a provider or a destination is compliant, and it does not transfer any of your own obligations to the provider.
| Dimension | Evidence to request | How to test the answer | Red flag that should trigger a re-quote |
|---|---|---|---|
| 1. Language and accent | Proficiency assessment scores for the actual named team, not a national index | Run a live assessment with your own script and your own customer accent profile | Only national average scores offered; team-level scores refused |
| 2. Time zone coverage | A staffing schedule showing which shift covers your required hours, with the differential broken out | Ask what happens to the schedule on the US daylight-saving changeover dates | Overlap claims offered without stating the assumed US or Canadian offset |
| 3. Cost structure | A loaded-cost breakdown with each driver on its own line, in a stated currency | Recompute with your own loaded-cost formula and compare against your second quote | A single all-in rate with no shift, statutory or attrition split |
| 4. Attrition and talent risk | Replacement-time service level, tenure data for the named account, and the team lead’s own tenure | Ask for the account-level turnover figure rather than a company-wide one | Company-wide attrition quoted in place of account-level data |
| 5. Data protection law | Written answers to the seven diligence questions in Dimension 5, naming the processing entity, storage locations, regulator and breach-notification timeline | Ask your own counsel whether the answers support your downstream obligations | A generic “we are compliant” statement with no entity, location or regulator named |
| 6. Industry maturity and function fit | Named team, supervisory structure, process documentation samples and a continuity plan | Ask to speak to an existing client in your function, not just your sector | References offered only in a different function from the one you are buying |
Each block above maps to a section of this article, so any answer you receive can be checked against a specific claim and its evidence class. Completed, the checklist is a one-page appendix to your shortlist memo.
If you want to run this checklist against a specific provider and see how the answers land in practice, the provider-side contact point is here: Outsourcing Service Provider in India. Disclosure, repeated because it matters at a commercial contact point: the publisher of this page is an India-based BPO and KPO provider [F20], so weigh that conversation accordingly, and note that this article makes no destination recommendation. The clearer statement of what the publisher offers is on the Business Process Outsourcing (BPO) services page.
Frequently Asked Questions
Note on method: the questions below reflect the People Also Ask shape observed for this topic during research. They were reconstructed from search-query expansion and related-question signals rather than scraped verbatim from a rendered widget, so treat them as an accurate representation of what buyers ask, not as a quotation of any search engine’s widget.
Is it better to outsource to India or the Philippines?
There is no overall winner, and any page that names one is probably working for that country. The better destination depends on which of the six dimensions dominates your scope. The Philippines leads on measured English proficiency, ranking 28th at 569 against India’s 74th at 484 on EF EPI 2025 (F1, F2, authoritative index), and leads on time zone proximity to North America, at UTC+08:00 against UTC+05:30 (F4, F5, authoritative time data). India leads on enterprise engineering, data science and knowledge-process depth on the attributed industry evidence (F15, attributed vendor report). See the trade-off profiles above for how those pull against each other.
Which country is cheaper for outsourcing: India or the Philippines?
No primary or government wage benchmark for either country was located in this research run, so no country-level saving figure can be asserted. What you can do is model loaded cost yourself: base rate plus shift differential plus statutory load plus attrition allowance plus management overhead plus facilities and connectivity. Headline rate comparisons mislead once shift differentials, statutory employer load and attrition replacement are added, because those three items vary by role and city and are frequently bundled invisibly into a single quoted rate. Ask for each on its own line. For context on why this page refuses a number: the publisher’s own published cost-saving claim of 75 percent or more is a first-party marketing figure [F20], not a benchmark, and is labelled as such here.
Is English better in the Philippines or India?
On measured proficiency, the Philippines. EF EPI 2025 ranks the Philippines 28th globally at 569, classified as high proficiency (F1, authoritative index), and India 74th at 484, classified as low proficiency and below the global average (F2, authoritative index). Function-level scores show the Philippines ahead in most business functions, with the gap narrowest in Customer Service at 579 against 531 and widest in HR at 580 against 450 (F3, authoritative index). Two caveats: the index is a general population measure and not a hiring benchmark for a specific role, and it does not measure accent neutrality or accent-training requirement. No primary source for accent preference was located in this run, so this page expresses none.
Is the Philippines the call center capital of the world?
That is a widely reported industry characterisation rather than a primary statistical title. Industry sources state the Philippines has held the position since approximately 2010, with Metro Manila, Cebu and Davao as the major hubs (F14, attributed vendor report). Separately and on the available reported figures, India remains larger in total IT-BPM scale: India’s outsourcing and IT services workforce is reported at approximately 5.95 million people with outsourcing contributing around 7 percent of GDP, a reported figure whose year was not established in this research run (F12, secondary report). Treat the Philippines’ voice and customer-experience delivery depth as well established and the ranking language as a media and industry shorthand, not a measured title.
What time zone is best for outsourcing to US clients?
For a North American buyer, the Philippines offers the smaller required night shift. Philippine Standard Time is UTC+08:00 year-round (F5, authoritative time data) and Indian Standard Time is UTC+05:30 year-round (F4, authoritative time data), so the Philippine window is 2.5 hours closer to North American working hours in every pairing. Overlap arithmetic must state the assumed North American offset, because the US and Canada observe daylight saving while neither destination does, so every figure shifts by an hour twice a year. One practical consequence: a 9:00 am Eastern stand-up lands at 7:30 pm IST and 10:00 pm PhST on a standard-time date. Both destinations run 24/7 night-shift models for North American hours (F16, attributed vendor report), so the difference is cost and retention, not capability.
Is the Philippines overtaking India in outsourcing?
Separate the two markets. One secondary news report states that the Philippines ranked first on the Ataraxis Global Outsourcing Talent Index with a score of 90.65, ahead of Malaysia and India, on cost competitiveness, English proficiency and workforce capability (F13, secondary news report). That supports a claim about growth in voice and customer-experience work and about one reported index result, whose methodology was not independently retrieved in this run. India’s reported total IT-BPM scale remains larger on the available figures, including a reported workforce of approximately 5.95 million (F12, secondary report, year not established). India’s reported strength in engineering and knowledge-process depth also remains distinct (F15, attributed vendor report). The honest answer is that the two markets are diverging by function, not that one is replacing the other.
Which is better for BPO: India or the Philippines?
Answer by function rather than by country. Voice and customer-experience roles lean toward the Philippines on the available evidence: EF EPI Customer Service scores of 579 against 531 (F3, authoritative index) and reported delivery depth since approximately 2010 (F14, attributed vendor report). Back-office processing and finance roles are viable in either country, with the trade-off being that the EF EPI Accounting and Finance gap is wide at 599 against 471 [F3] for consultative work, so separate transactional processing from advisory work inside the same tower. Engineering, data and knowledge-process roles lean toward India on the reported maturity evidence (F15, attributed vendor report). Use the function-fit table above and test with a paid pilot before committing.
How does India’s DPDP Act 2023 compare with the Philippines’ Data Privacy Act for offshore vendors?
The statutory facts are these. India’s data protection statute is the Digital Personal Data Protection Act, 2023, published in the Gazette of India by the Ministry of Electronics and Information Technology (F7, government source). The Philippines’ statute is Republic Act No. 10173, the Data Privacy Act of 2012, which establishes the National Privacy Commission as regulator and covers general data privacy principles, rights of the data subject, security of personal information, accountability for transfer of personal information, and penalties in Sections 25 to 36 (F8, government source). What matters more for a buyer is that your own obligations under US state privacy law, Canadian PIPEDA and applicable provincial statutes, HIPAA or GDPR do not transfer to the vendor’s jurisdiction and neither destination resolves them. Ask the seven diligence questions in Dimension 5 and get written answers naming the entity, the storage location and the regulator.
Why does this page not recommend one country?
The publisher of this page is an India-based BPO and KPO provider (F20, first-party source), so any recommendation of India would be self-interested and any recommendation of the Philippines would be implausible. A neutral comparison is the only defensible format. There is a second reason: the pages currently ranking for this topic are predominantly vendor-owned, which means destination bias is a structural feature of the information available to buyers rather than an occasional flaw. The purpose of this page is to help you defend a shortlist on evidence, not to direct your decision. Weigh the India data points here against that disclosure, as you should weigh any country’s data points against whoever published them.
Ready to Fix This in Your Business?
Talk to our team about the role you want off your plate.
Where to Go Next
Sources and References
Every bracketed marker in this article maps to exactly one entry below.
- [F1] https://www.ef.com/wwen/epi/regions/asia/philippines/. https://www.ef.com/wwen/epi/regions/asia/philippines/ (authoritative)
- [F2] https://www.ef.com/wwen/epi/regions/asia/india/. https://www.ef.com/wwen/epi/regions/asia/india/ (authoritative)
- [F3] https://www.ef.com/assetscdn/WIBIwq6RdJvcD9bc8RMd/cefcom-epi-site/reports/2025/ef-epi-2025-english.pdf. https://www.ef.com/assetscdn/WIBIwq6RdJvcD9bc8RMd/cefcom-epi-site/reports/2025/ef-epi-2025-english.pdf (authoritative)
- [F4] https://www.timeanddate.com/time/zone/india/new-delhi. https://www.timeanddate.com/time/zone/india/new-delhi (authoritative)
- [F5] https://www.timeanddate.com/time/zone/philippines/manila. https://www.timeanddate.com/time/zone/philippines/manila (authoritative)
- [F6] https://en.wikipedia.org/wiki/Philippine_Time_Zone. https://en.wikipedia.org/wiki/Philippine_Time_Zone (secondary)
- [F7] https://www.meity.gov.in/static/uploads/2024/06/2bf1f0e9f04e6fb4f8fef35e82c42aa5.pdf. https://www.meity.gov.in/static/uploads/2024/06/2bf1f0e9f04e6fb4f8fef35e82c42aa5.pdf (government)
- [F8] https://privacy.gov.ph/data-privacy-act/. https://privacy.gov.ph/data-privacy-act/ (government)
- [F16] https://outsourced.ph/comparing-india-and-philippines/. https://outsourced.ph/comparing-india-and-philippines/ (industry)
- [F20] https://capstoneplanet.com/. https://capstoneplanet.com/ (first_party)
About the Author

Kishan Dangi (KK Patel)
Founder and CEO, CapStonePlanet
Kishan leads CapStonePlanet, an India-based outsourcing partner that builds dedicated offshore teams for US and Canadian businesses across customer support, back-office, recruitment support, and domain BPO.
+